Portfolio Insights
PaTMa Property Manager makes it that much easier to assess the performance and future of your investment. With easy access to visual representations of your portfolio value, rate of expenses and current occupancy, you can boost the performance of your portfolio and make it much more profitable.
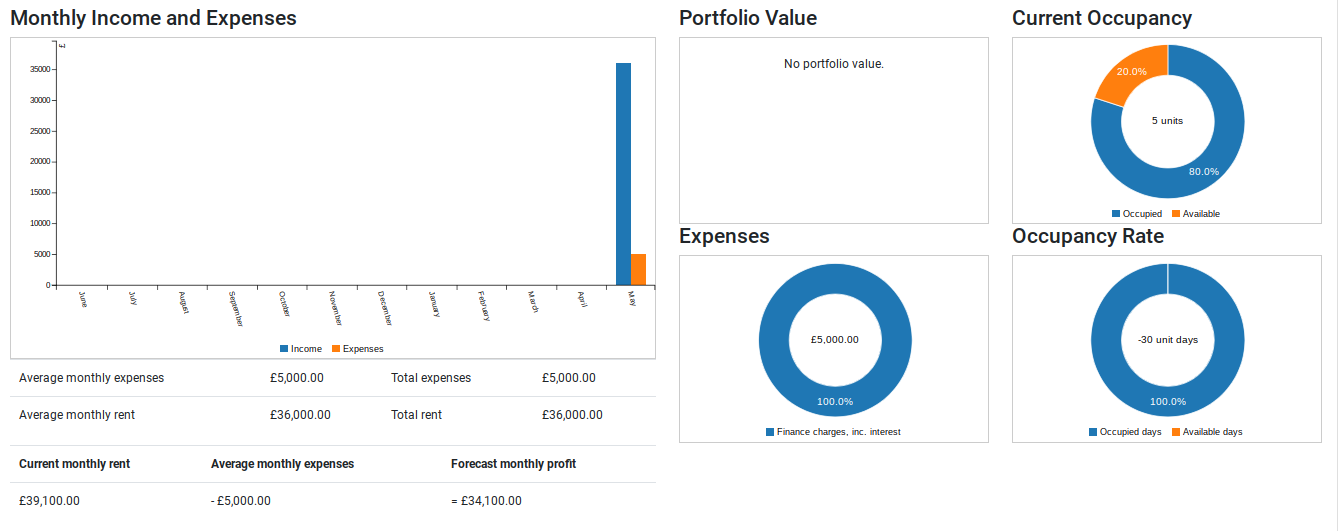
It Offers The Following Insights:
- Monthly Income vs Expenses
- Average Income vs Expenses
- Components of Expenses
- Current Occupancy
- Occupancy Rates
- Portfolio Value
A large part of property management involves the ability to analyse and understanding the performance of your portfolios so that you can continuously improve and ultimately make more money.
However, with every single property produces a huge amount of data that can become tedious when systems aren't sufficiently integrated it becomes even harder to make use of information and in some cases, you may get lost in the data. PaTMa offers a powerful solution: by presenting all your data in clear formats, using graphs and charts, you can acquire great insights into your properties and their performance. You can see what your property is earning and what it is costing, and see where savings or improvements can be made with no extra work.
Get Started
- Log in to your PaTMa Account.
- Navigate to Dashboard located in the header.
- Click Status Overview and you will immediately be redirected to the viewing page of your portfolio insights.